Most of the people always consider the Java heap size as the RAM usage a Java application, but this is wrong. Actually your java application is not the process which is running when you start it, but its an instance of JVM which starts. Your application code is supplied as an argument to the JVM process. The actual RAM usage is by the JVM process and heap is a portion of it the JVM gives to your Java code for holding the Java objects.
The actual RAM usage of your Java application (JVM) can be find using “top” command in Linux just like any other process. However the heap usage which will always be less than the RAM usage can be found using tolls like jconsole only, because its a Java specific thing.
Now you know why “RES” column output of top command and Java Heap size is always different.
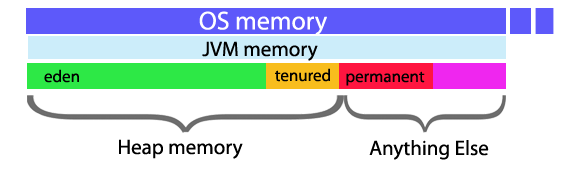
As most of you know we can specify the heap for any Java application. The java objects will be using this heap. The moment your Java code requests any more memory than provided as the max heap size JVM will throw OutOfMemory error.
Apart from the Heap, JVM uses the RAM for the following which all together constitutes the “RES” output in “top” command.
– Generated (JIT:ed) code
– Loaded libraries (including jar and class files)
– Control structures for the java heap
– Thread Stacks
– User native memory (malloc:ed in JNI)
Want to know more?
Discover more from Anil G Kurian
Subscribe to get the latest posts sent to your email.
